
Turning Presentation Content Into a Visual Narrative
Presentation Design & Motion
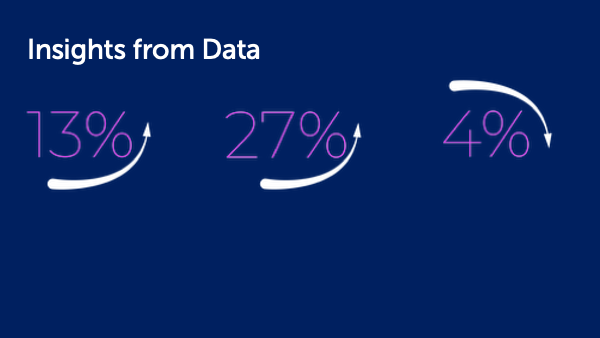
The goal was to ceate an engaging presentation that demonstrates how story structure, imagery, data, and motion can make ideas clearer and more memorable.
Context
Visual Storytelling explores how narrative elements such as setting, characters, conflict, and resolution can strengthen presentations.
My Role
I developed the narrative structure, visual concept, slide layouts, typography, imagery, data treatments, animations, and Morph transitions.
Process
Organized the content around a clear storytelling framework.
Used bold imagery and concise typography to focus attention.
Simplified charts into meaningful, audience-friendly data points.
Added animations, progressive reveals, and Morph transitions to create continuity and guide the presentation’s pace.
Result
The final presentation uses visual storytelling principles to teach visual storytelling, creating a cohesive experience in which content, animation, and motion work together.
Reflection
This project reinforced how purposeful movement can do more than add visual interest. Animation and Morph can connect ideas, control pacing, and help an audience follow the story.


The Story Is Already in the Data. Design Reveals It.
Presentation & Information Design
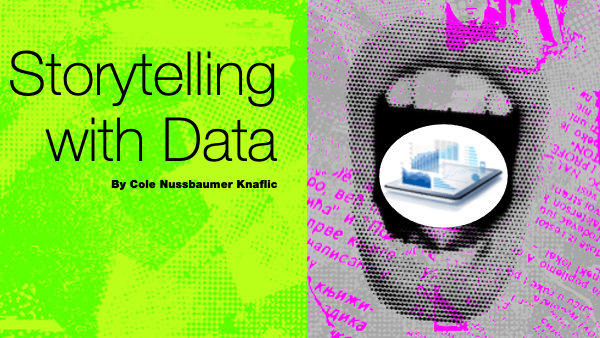
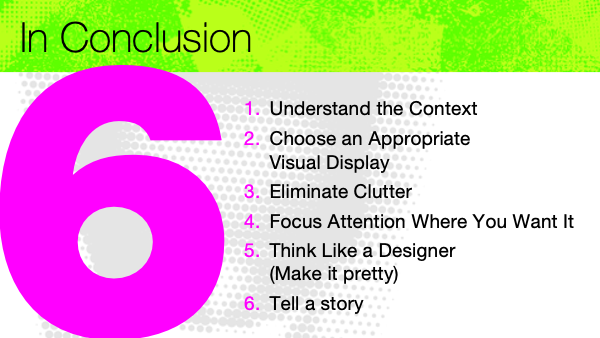
The goal was to create an engaging educational presentation that shows how context, hierarchy, chart selection, and storytelling can turn complex data into a clear visual message.
Context
Storytelling With Data explores practical ways to improve data communication, from selecting the right chart and removing clutter to directing attention and creating a focused narrative. My Role
I developed the visual concept, content structure, slide layouts, typography, chart treatments, animations, and transitions.
Process
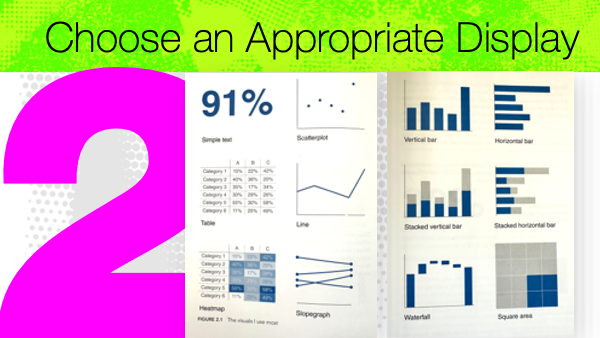
Organized the presentation around six core principles.
Used bold typography, color, and scale to establish hierarchy.
Paired ineffective charts with clearer alternatives to demonstrate each lesson.
Used animations and progressive reveals to focus attention and control the pace of information.
Result
The final presentation turns data-visualization principles into a memorable learning experience, using direct comparisons and purposeful motion to make each concept easier to understand.
Reflection
This project reinforced that effective data storytelling is not about showing everything. It is about removing distractions, establishing a clear point of view, and guiding the audience toward what matters most.
NHLBI PowerPoint Templates
Presentation System Design
One Brand, Two Flexible Ways to Tell the Story
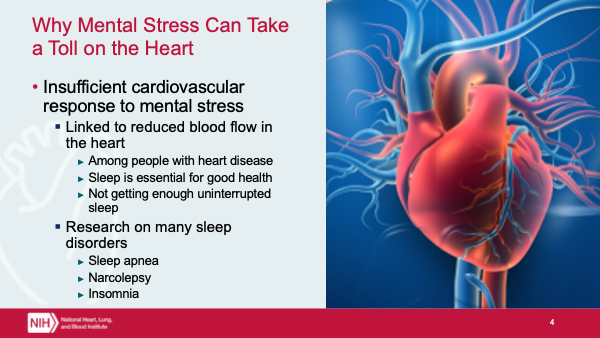
The Goal was to create two flexible PowerPoint templates that give NHLBI presenters clear, professional tools for communicating complex health and scientific information while maintaining a consistent institutional identity.
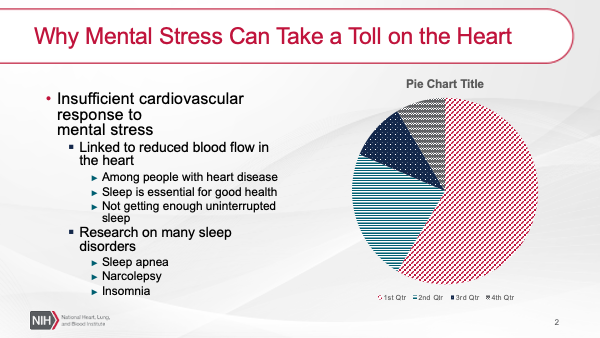
Template A

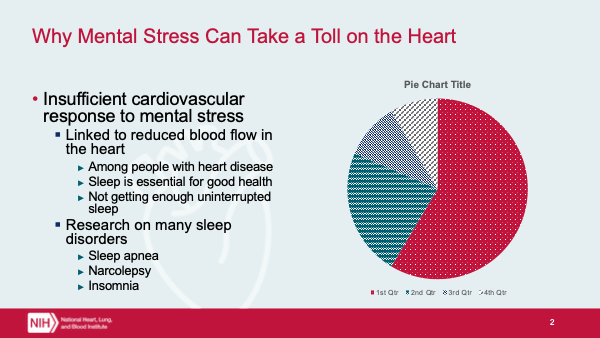
Template B

Context
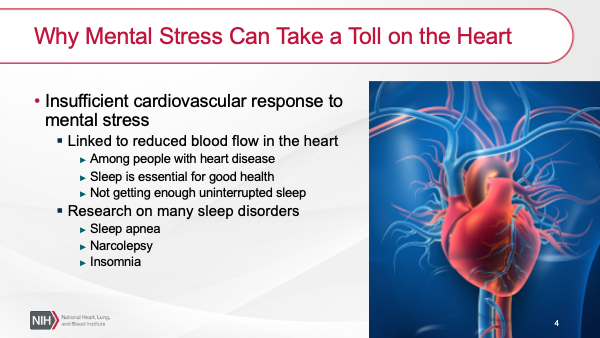
The templates were designed to support a range of presentation needs, from data-heavy research slides to image-led storytelling. Each direction interprets the NHLBI brand differently while providing a cohesive structure for titles, section breaks, charts, images, and detailed content.
My Role
I developed the two visual directions, slide architecture, typography, color systems, image treatments, chart styling, and reusable layouts.
Process
Created two distinct design systems within the NHLBI brand.
Built flexible layouts for titles, sections, charts, images, and multilevel content.
Established consistent hierarchy for dense scientific and health information.
Used branded colors, medical imagery, and custom graphic elements to unify each template.
Designed master layouts that presenters could reuse without compromising the visual system.
Result
The final templates give presenters two polished, adaptable systems for building clear and consistent presentations across a wide range of topics.
Reflection
This project reinforced that a successful template must do more than look polished. It needs to anticipate real content, accommodate different presentation styles, and make strong design easier to maintain from slide to slide.


Health Care Enterprise Issue
Strategic Presentation Design
Turning a Complex Health Care Strategy Into a Clear Path Forward
The Goal was to create an engaging presentation that transforms a multi-year health care strategy into a clear, compelling narrative, helping audiences understand the long-term vision, five strategic priorities, intended outcomes, and the people responsible for advancing the work.
Context
This presentation was developed for AARP’s Health Care Enterprise Issue team to communicate strategies for improving the affordability, accessibility, and quality of health care for people age 50 and older.
My Role
I developed the visual concept, presentation structure, slide layouts, information hierarchy, typography, color system, iconography, and image treatments.
Process
Organized the presentation from long-term vision to strategies, outcomes, partners, and team.
Gave each of the five strategies its own color and icon for quick recognition.
Used bold typography and photography to connect policy priorities to the people affected.
Created focused layouts for detailed content, projected outcomes, and a large team roster.
Repeated visual elements across overview and detail slides to maintain continuity.
Result
The final presentation turns a complex strategic plan into a cohesive visual story, making five interconnected priorities easier to follow, distinguish, and remember.
Reflection
This project reinforced how a strong presentation system can bring clarity to complicated organizational content. Consistent color, imagery, icons, and hierarchy helped transform dense strategic information into a story with structure, momentum, and human relevance.